Gis3015 Map Catalog

Thursday, April 17, 2014

Triangular plot

File:Ag-Au-Cu-colours-english.svg
http://en.wikipedia.org/wiki/Ternary_plot

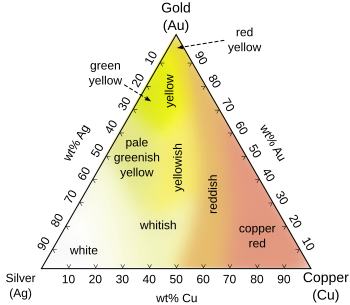
The Triangular plot is based off of three variables and portrays the ratios of the three variables. The above diagram is the representation of the different colors of Copper, Silver, and Gold. The colors clearly change as it gets closer to the other elements.
Posted by Unknown at 5:25 PM
Email ThisBlogThis!Share to XShare to FacebookShare to Pinterest

No comments:

Post a Comment

Newer Post Older Post Home
Subscribe to: Post Comments (Atom)

About Me

Unknown
View my complete profile

Blog Archive

  • ▼  2014 (50)
    • ▼  April (50)
      • Black and white aerial photo
      • Standardized Choropleth Map
      • Bilateral Graph
      • Univariate Choropleth Map
      • Bivariate choropleth map
      • Lorenz curve
      • Correlation matrix
      • Similarity matrix
      • Histogram
      • Parallel coordinate graph
      • Star plot
      • Windrose
      • Box plot
      • Stem and Leaf plots
      • Triangular plot
      • Index value plot
      • Population profile
      • Climograph
      • Scatter plot
      • Unstandardized Choropleth map
      • Range graded proportional dot map
      • Proportional circle map
      • DOQQ
      • DEM
      • DLG
      • DRG
      • Isopleth
      • Isopach
      • Isohyet
      • Isotach
      • Isobars
      • LIDAR
      • Doppler radar
      • Infrared Aerial photography
      • Cartographic animations
      • Statistical map
      • Cartograms
      • Flow maps
      • Isoline maps
      • mental map
      • Choropleth map
      • Dot Distribution map
      • Propaganda map
      • hypsometric map
      • PLSS map
      • Continously variable proportional dot maps
      • cadastral map
      • planimetric maps
      • Thematic maps
      • Topographic map
Simple theme. Powered by Blogger.