http://support.sas.com/documentation/cdl/en/asstgs/58944/HTML/default/viewer.htm#a000171151.htm
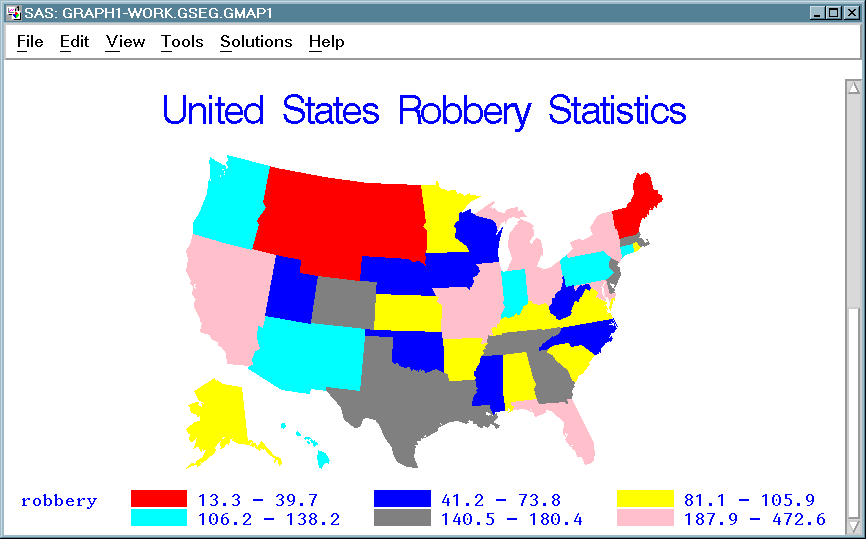
Statistical maps use colors and other features to represent statistical values of certain regions. These values could be crime rates, car accidents, really anything that can be described by using a statistic. If the statistic varies in different regions, this map visualizes the variation and gives the viewer a good idea of the statistic.
No comments:
Post a Comment