http://www.ala.org.au/blogs-news/environmental-discontinuity-in-the-distribution-of-eucalyptus-camaldulensis/
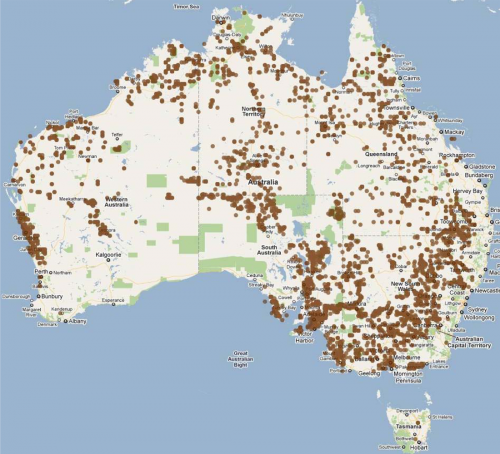
Dot Distribution maps use dots to represent the value or quantity of something in a certain area. There are usually large scale maps. The dots can change in size depending on the value of the information it represents. The map above represents the number of red river gum found in Australia. These dots show that the most rred river gum was found in the southeast portion of Australia.
No comments:
Post a Comment